The Constructor
Enable users to construct their own dashboard with charts from a chart library
Created by Luzmo.
TypeScript
ACK
Dashboard
AI
The Constructor
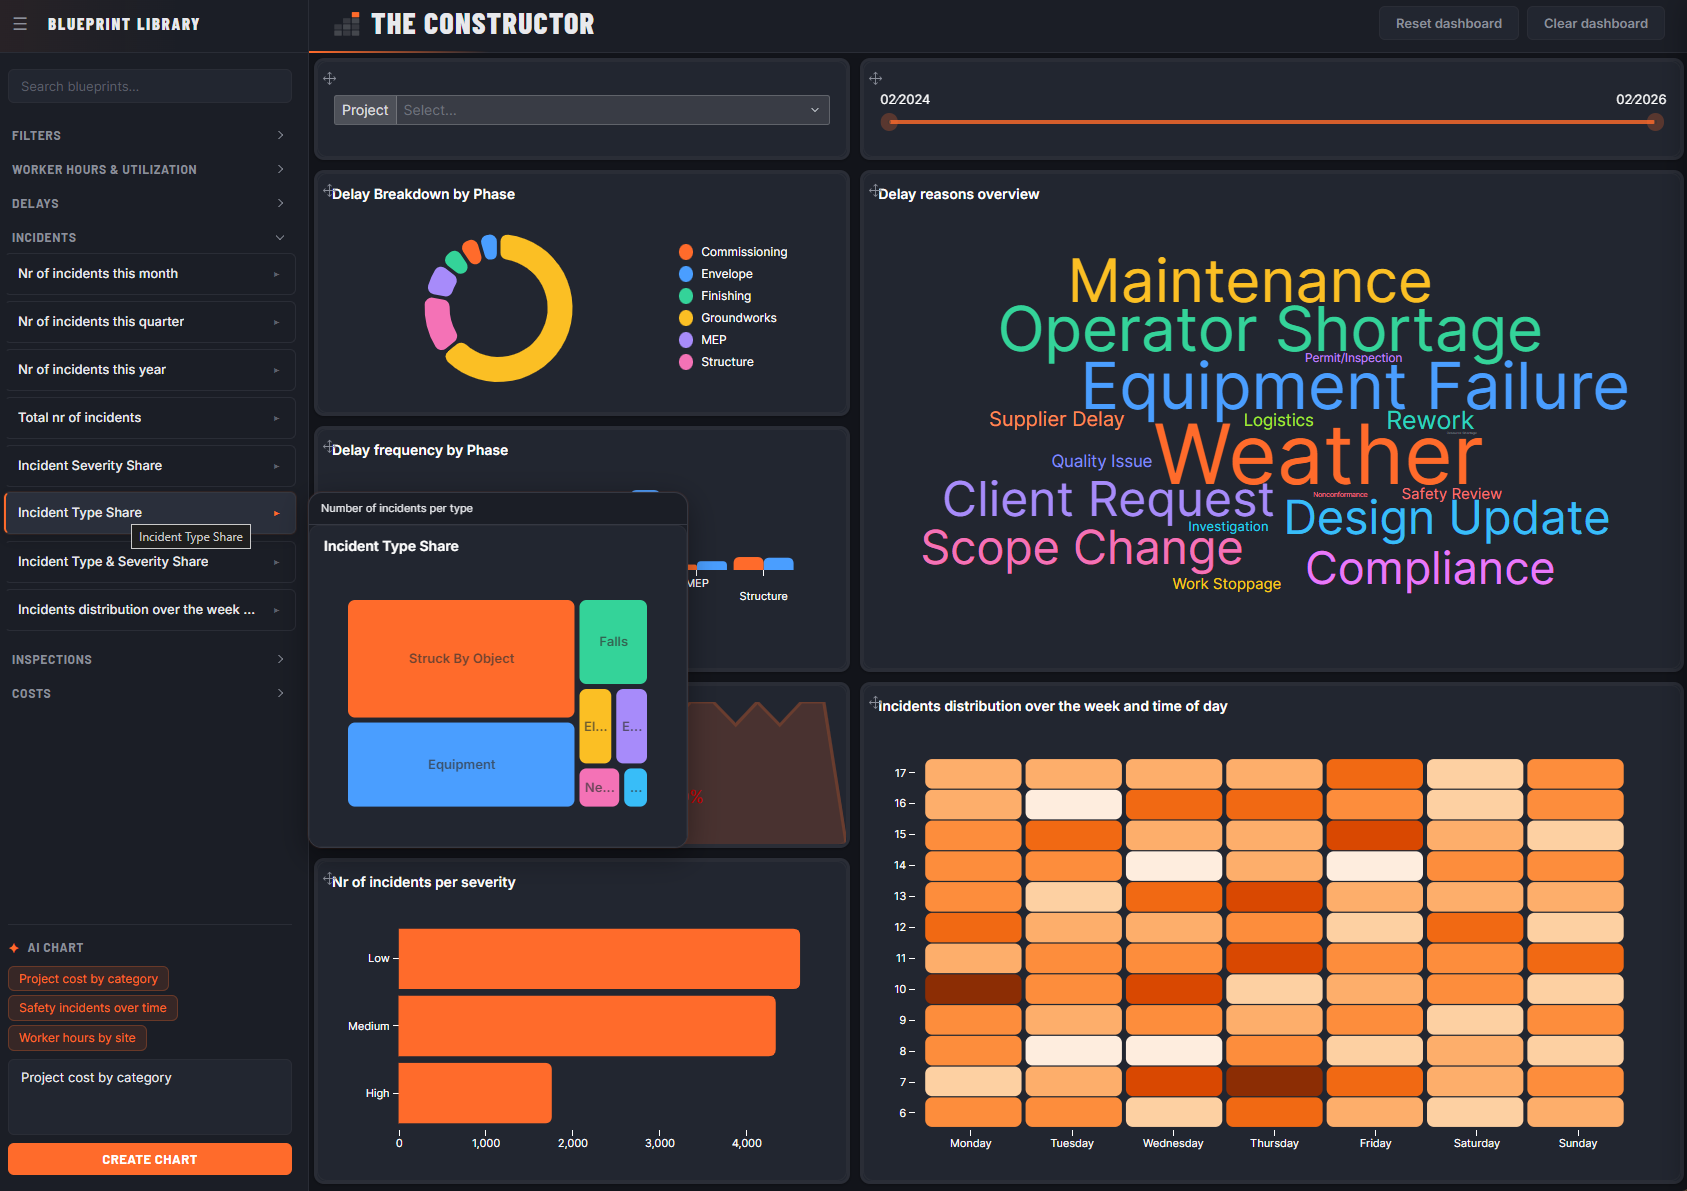
Construction-focused end-user analytics experience built on Luzmo.
Browse live chart visualizations in the sidebar and compose a personal dashboard by clicking to add tiles. Charts are fetched from all dashboards accessible to the embed key/token via the /securable REST API; the main canvas uses <luzmo-item-grid> for drag-and-drop layout and chart rendering.
Features
- Token-scoped loading — all dashboards accessible to the embed key/token are fetched via
/securableand grouped by source dashboard in a collapsible sidebar. - Template dashboard — a dashboard named "template" (case-insensitive) is auto-detected and pre-rendered on first load.
- Hover preview — hovering a sidebar card shows a live chart popup anchored to the card's right edge.
- Dashboard grid —
<luzmo-item-grid>handles drag-and-drop layout, resize, and per-tile action menus. - Chart type switching — slide-out edit panel lets users change chart type (filtered to compatible types only) and toggle the legend via
<luzmo-item-option>. All chart types are supported, including variants (stacked, 100%, streamgraph, semi-donut, etc.). - Persistence — tile layout, chart overrides, and AI-generated charts are saved to
localStorageand restored on reload. - Search — filter charts by name, type, or description.
- Reset / Clear — restore the template layout or clear all tiles.
- Per-dashboard theming — live theme configs are always re-fetched. Theme rounding/padding defaults are explicitly applied to grid items.
- Dashboard filters — item-level filters (
itemFilter) are applied to sidebar previews and grid tiles. Initialization filters (filterFromFilterItem→selectedData) pre-populate filter widgets in sidebar previews. - AI chart generation — describe a chart in plain language; the Luzmo
/aichartAPI generates it and places it on the dashboard. AI charts survive page reloads.
Tech Stack
- Vanilla TypeScript — No React, Vue, or Angular
- Vite — Build tool and dev server
- @luzmo/analytics-components-kit — grid (
<luzmo-item-grid>), edit option (<luzmo-item-option>), and Luzmo design tokens - @luzmo/embed — Flex SDK for sidebar chart previews (
<luzmo-embed-viz-item>) - Luzmo REST API — Dashboard data via
/securable; theme info via/theme; AI chart generation via/aichart
Getting Started
Create a
.envfile and fill in your embed credentials:VITE_LUZMO_EMBED_KEY=your-embed-key VITE_LUZMO_EMBED_TOKEN=your-embed-tokenInstall and start:
npm install
npm run dev
The dev server starts at http://localhost:5173.
Build
npm run build
npm run preview
Further Reading
See AGENTS.md for architecture rules and implementation guidelines.
Good decisions start with actionable insights.
Take your data products to the next level with Luzmo.