SustainIQ
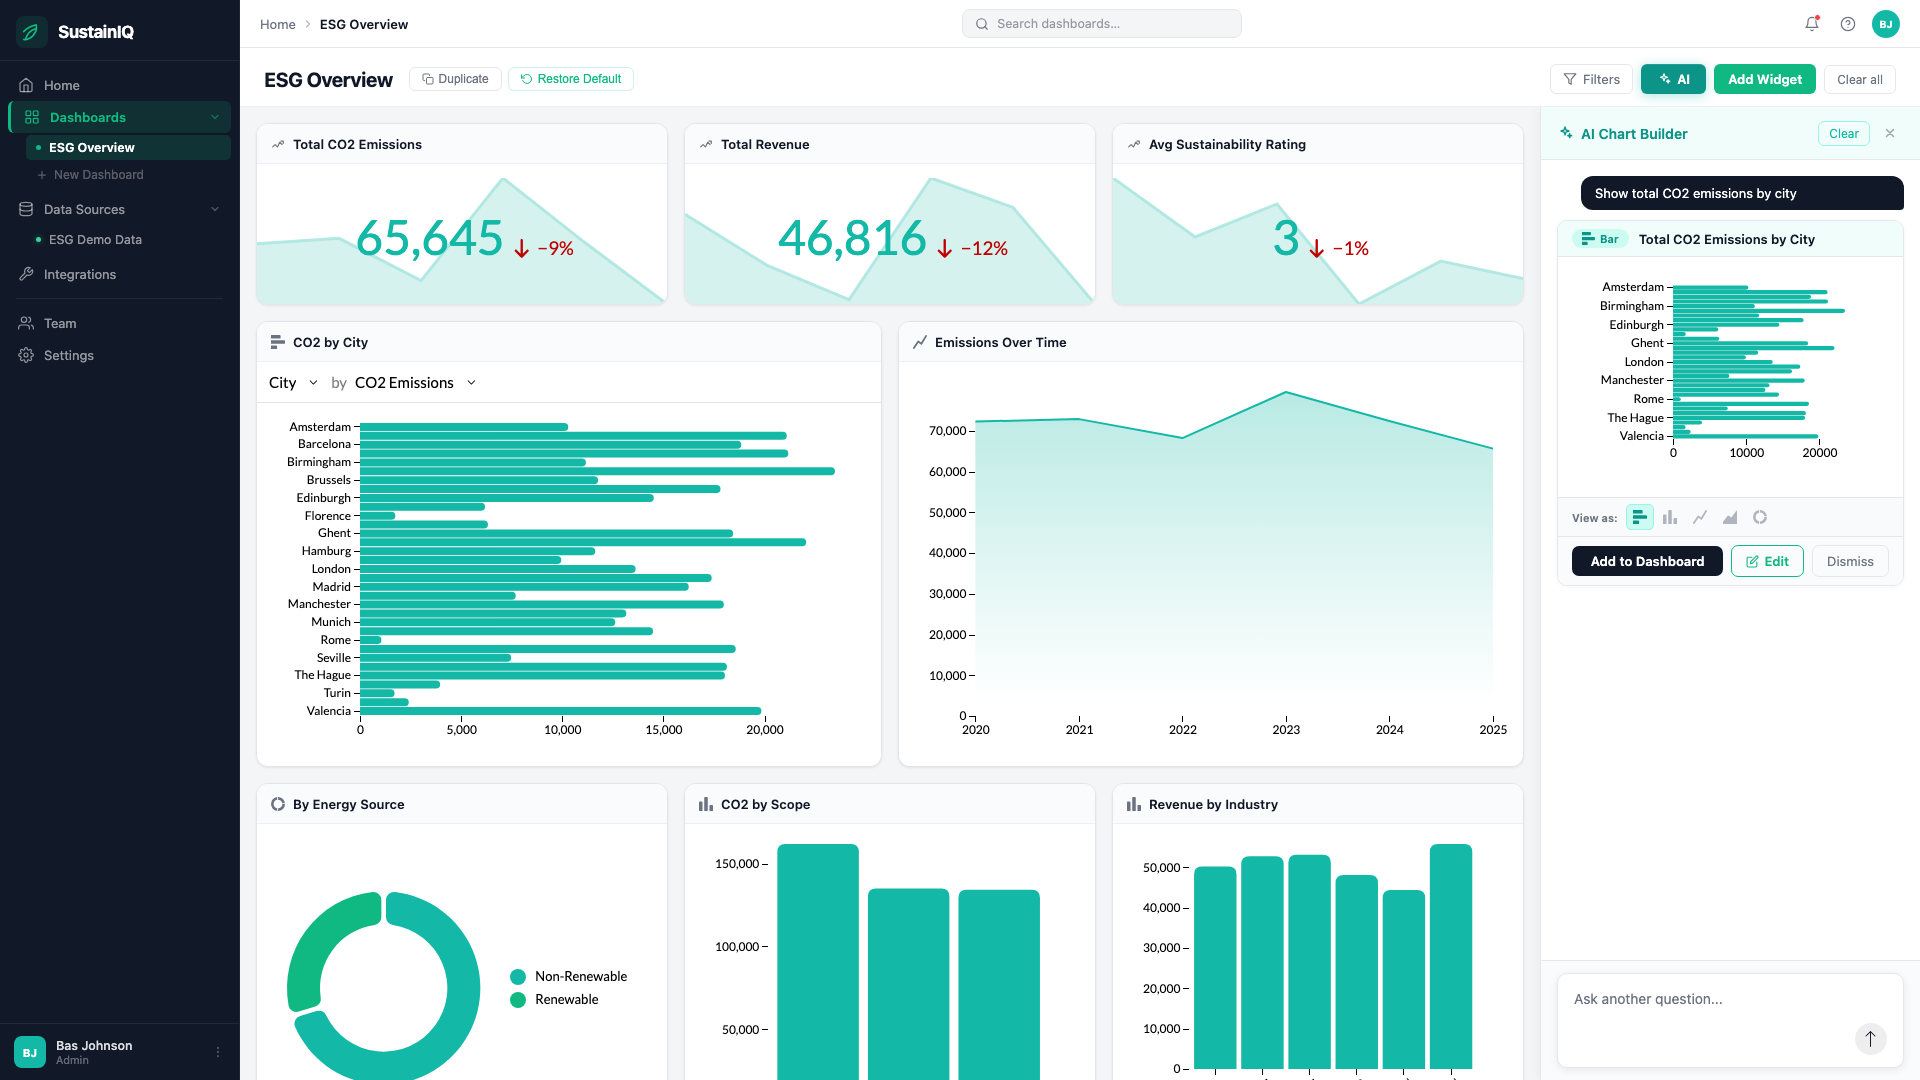
Interactive ESG dashboard with AI chart generation, drag-and-drop layout, cross-filtering, and multi-dashboard management.
Created by Luzmo.
React
TypeScript
Flex
AI
ACK
SustainIQ
An interactive analytics dashboard for tracking CO2 emissions, revenue, and sustainability metrics across cities, industries, and energy sources. Built with React, Vite, and the Luzmo Flex SDK.
Features
- AI Chart Builder — describe what you want in plain English and get a chart via the Luzmo
/aichartAPI, called directly from the browser using the embed token - 13+ chart types — bar, column, line, area, donut, treemap, scatter, bubble, radar, funnel, heatmap, table, KPI — rendered with
LuzmoVizItemComponent(Flex SDK) - Drag-and-drop layout with resize via
react-grid-layout - Cross-filtering across all charts, handled natively by the Luzmo SDK via shared
contextId - Multi-dashboard — create, duplicate, rename, and switch between dashboards; state persists in
localStorage - Visual chart editor with ACK slot picker and chart type switcher
- Pre-configured widget templates — get started instantly with 8 ready-made widgets (KPIs, bar/line/donut charts, tables) that can be added from the widget picker or restored as a default dashboard
- Dimension filters — filter by industry, city, region, and energy source
- Embed auth — key/token are read from environment variables at build time
Tech Stack
| Layer | Technology |
|---|---|
| Frontend | React 18, TypeScript, Vite |
| Charts | @luzmo/react-embed (Flex SDK) |
| Chart Editor | @luzmo/analytics-components-kit |
| AI Prompt | @luzmo/lucero |
| Layout | react-grid-layout |
Getting Started
- Create a
.envfile and fill in your embed credentials:
VITE_LUZMO_EMBED_KEY=your-embed-auth-key
VITE_LUZMO_EMBED_TOKEN=your-embed-auth-token
VITE_LUZMO_API_HOST=https://api.luzmo.com
VITE_LUZMO_APP_SERVER=https://app.luzmo.com
VITE_LUZMO_DATASET_ID=your-dataset-uuid
To generate an embed token, use the Luzmo Authorization API with your org API key/token (server-side). The resulting id and token are your VITE_LUZMO_EMBED_KEY and VITE_LUZMO_EMBED_TOKEN.
- Install and start:
npm install
npm run dev
The dev server starts at http://localhost:5173.
Build
npm run build
npm run preview
Good decisions start with actionable insights.
Take your data products to the next level with Luzmo.