Sales Compass
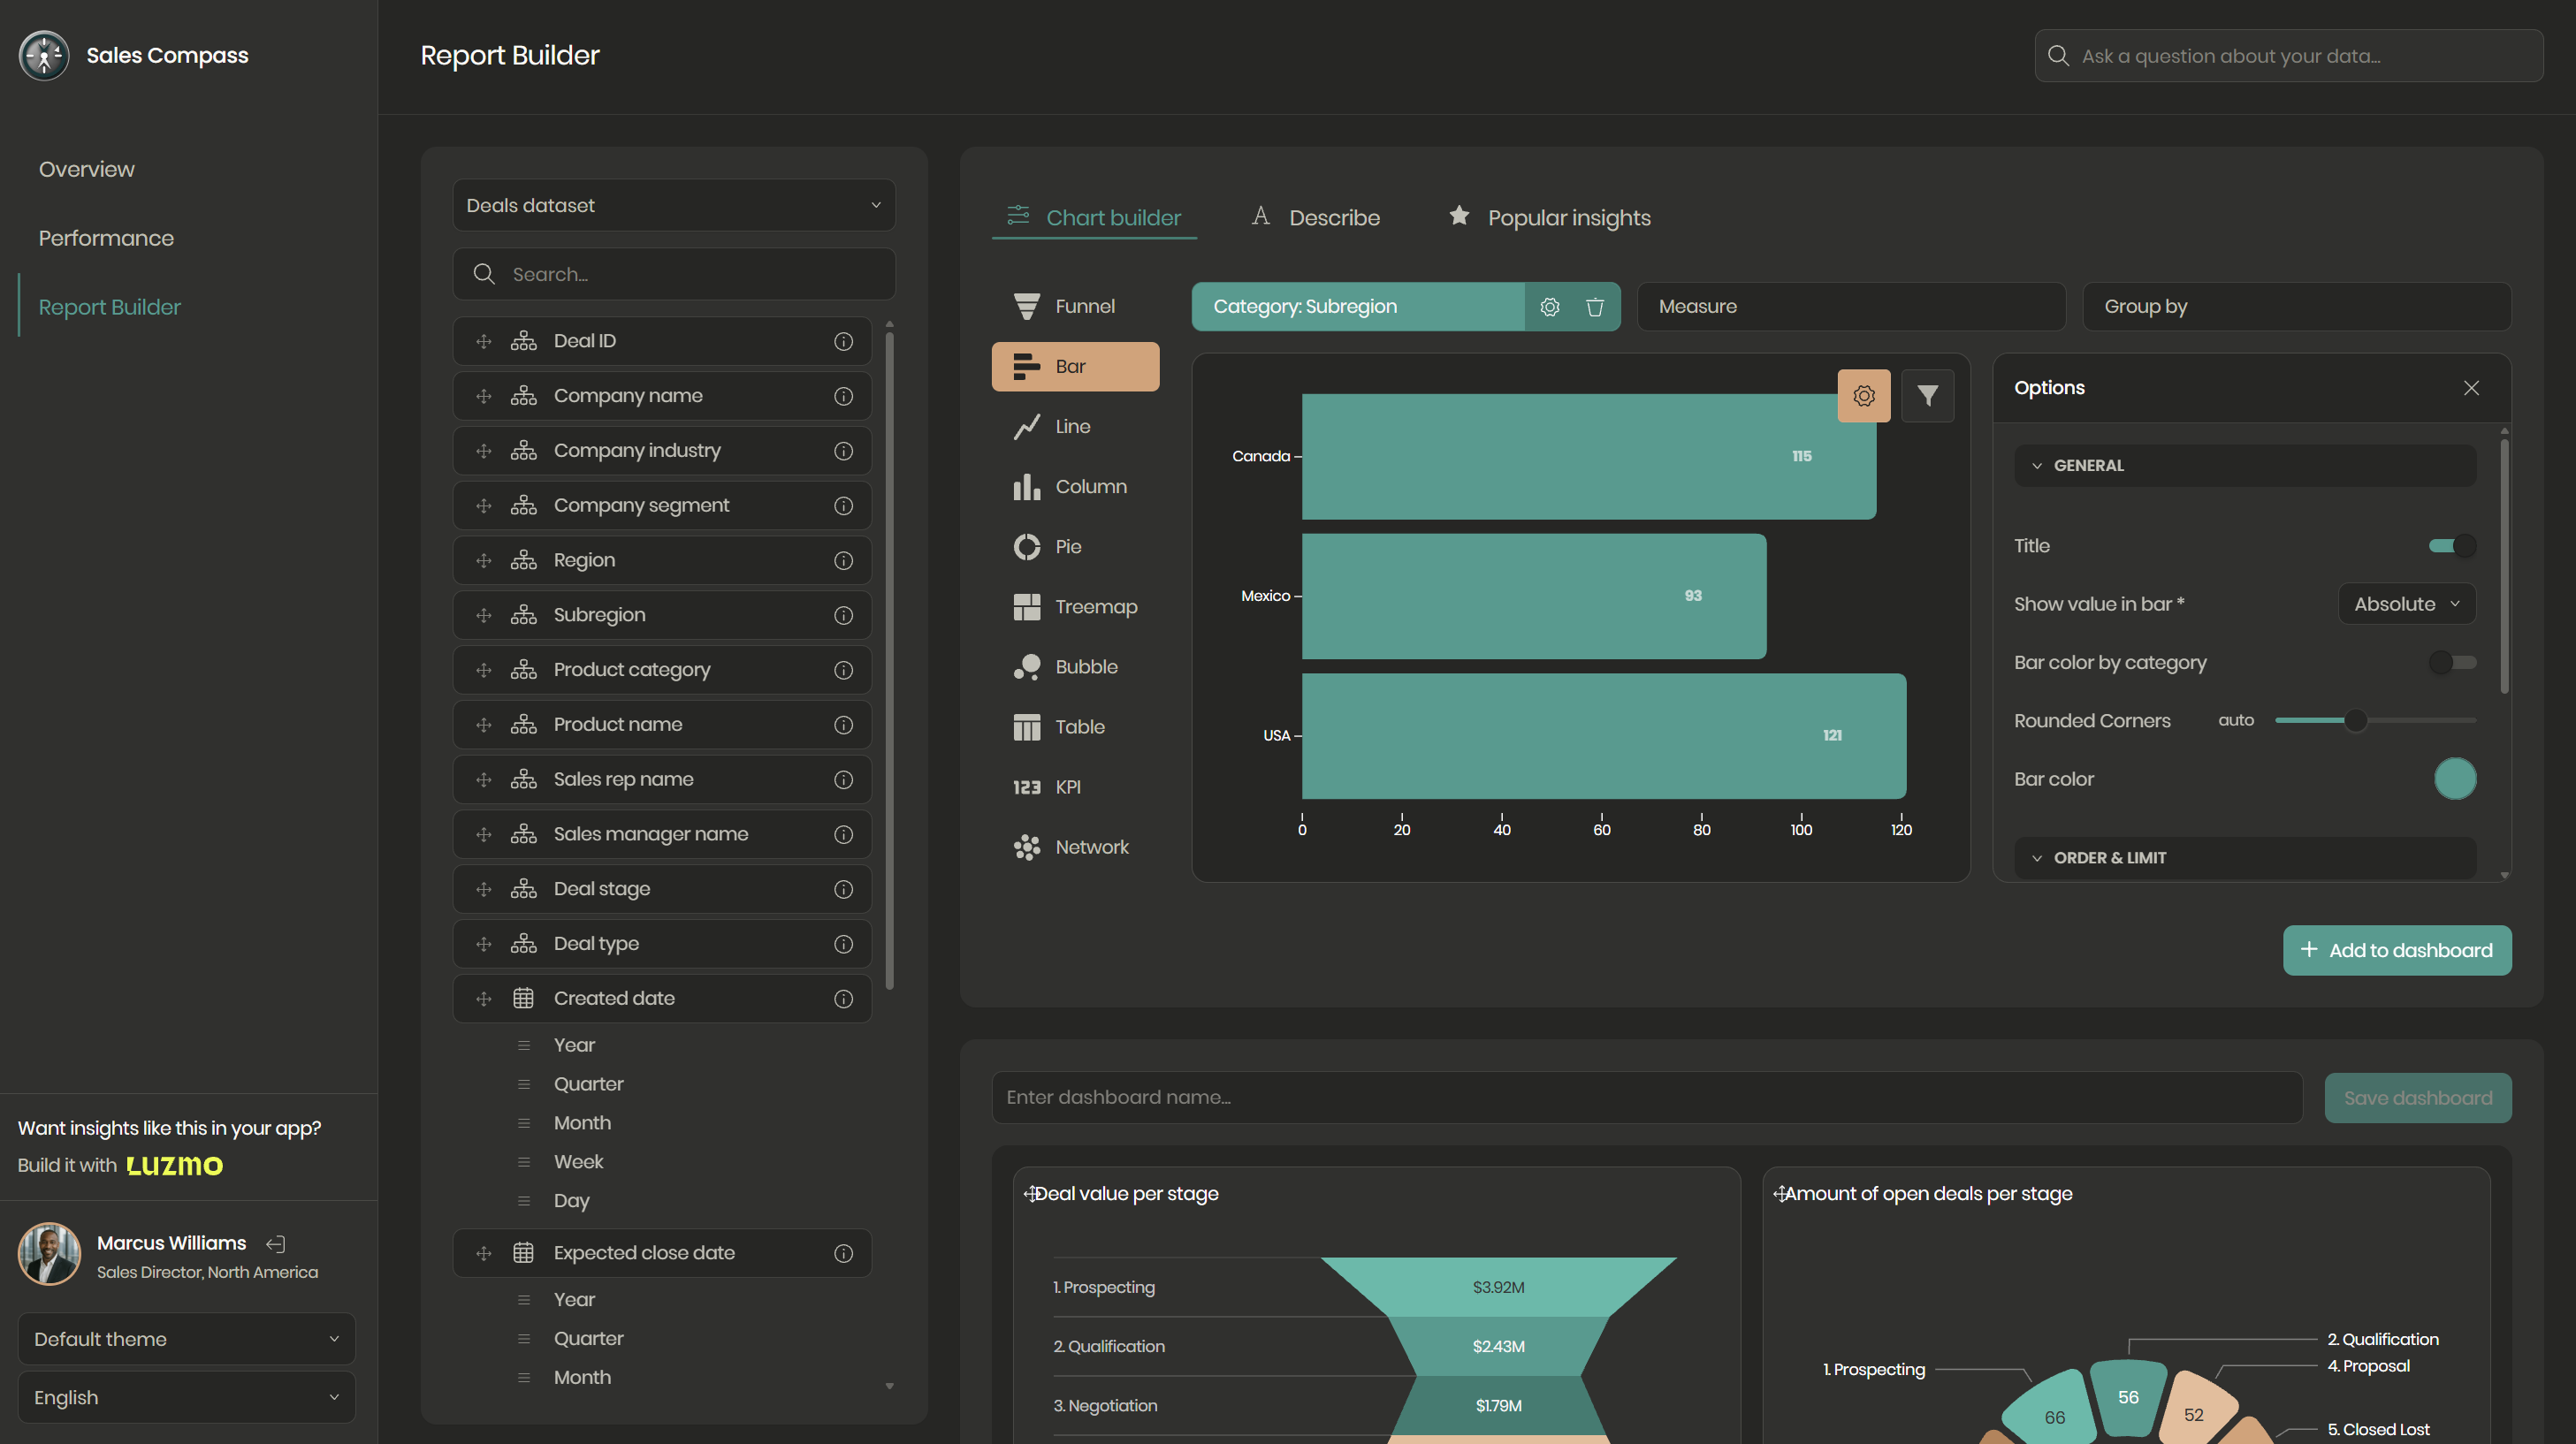
A sales analytics app that demonstrates Luzmo's embedded analytics capabilities end-to-end: interactive dashboards, AI-powered summaries, a conversational analytics assistant, and a self-service report builder.
Created by Luzmo.
Angular
ACK
AI
Node.js
To run this app locally:
- Create a local.cjs file in
backend/config - Add the following config in
backend/config/local.cjs. Use your Luzmo API credentials and your own collection ID.
module.exports = {
  luzmo: {
    apiToken: "<your Luzmo API key>",
    apiKey: "<your Luzmo API token>",
    collectionId: "33c447d5-06a7-4edc-bcce-c3c241987567",
    apiUrl: "<your Luzmo API URL (default: https://api.luzmo.com)>",
  },
  port: 3101,
  local: true,
};
- Install dependencies and start both backend and frontend
npm run install-all
npm start
Note: this project uses specific dataset, dashboard and chart id's through the code for the purpose of this demo. You can change these to point to your own datasets/dashboards/charts. Add the datasets and dashboards you want to use to a Collection in Luzmo and reference this collection ID in backend/config/local.cjs.
Then, update specific IDs throughout the frontend (e.g. in \frontend\src\app\constants\luzmo-constants.ts) to make the charts render correctly.
Good decisions start with actionable insights.
Take your data products to the next level with Luzmo.