Newspaper Data Journalism
A long-form data journalism page styled as a broadsheet newspaper, with interactive Luzmo Flex charts woven into the narrative — exploring global coffee consumption, latte prices by city, and the surprising link between caffeine spending and productivity.
Created by Luzmo.
Angular
ACK
Flex
Newspaper Data Journalism
Embed interactive data visualizations inside long-form editorial content — styled as a broadsheet newspaper article about the global coffee economy.
Features
- Interactive choropleth map of per-capita coffee consumption with region zoom controls (Europe, North America, Asia-Pacific)
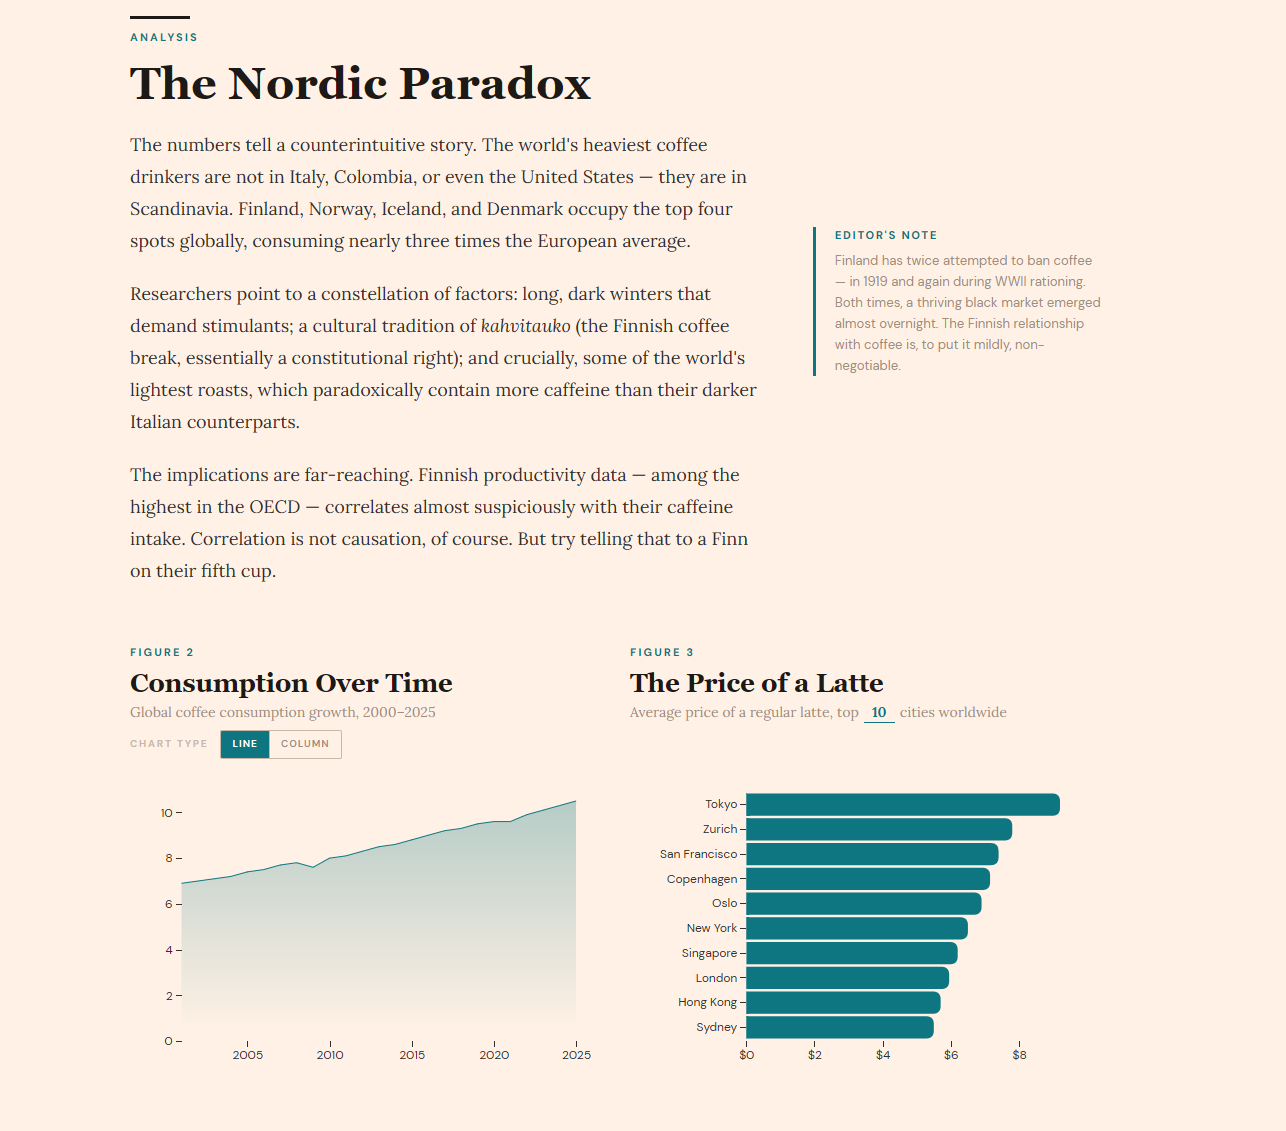
- Line / column chart toggle for global consumption trends (2000–2025)
- Dynamic top-N bar chart of latte prices by city, adjustable from 1 to 20
- Scatter plot of national coffee spend vs. productivity, filterable by region
Getting started
Prerequisites
- Node.js
- npm
Install & run
npm install
npm start
The app starts on http://localhost:4200.
The charts use publicly available Luzmo datasets.
Demo data
CSV files live in data/ for reference and customization:
data/coffee_consumption_by_country.csvdata/coffee_consumption_over_time.csvdata/coffee_spend_vs_productivity.csvdata/latte_price_by_city.csv
Good decisions start with actionable insights.
Take your data products to the next level with Luzmo.