Composable Analytics Builder
Guide users through building charts and tables from raw data, then compose them into interactive dashboards
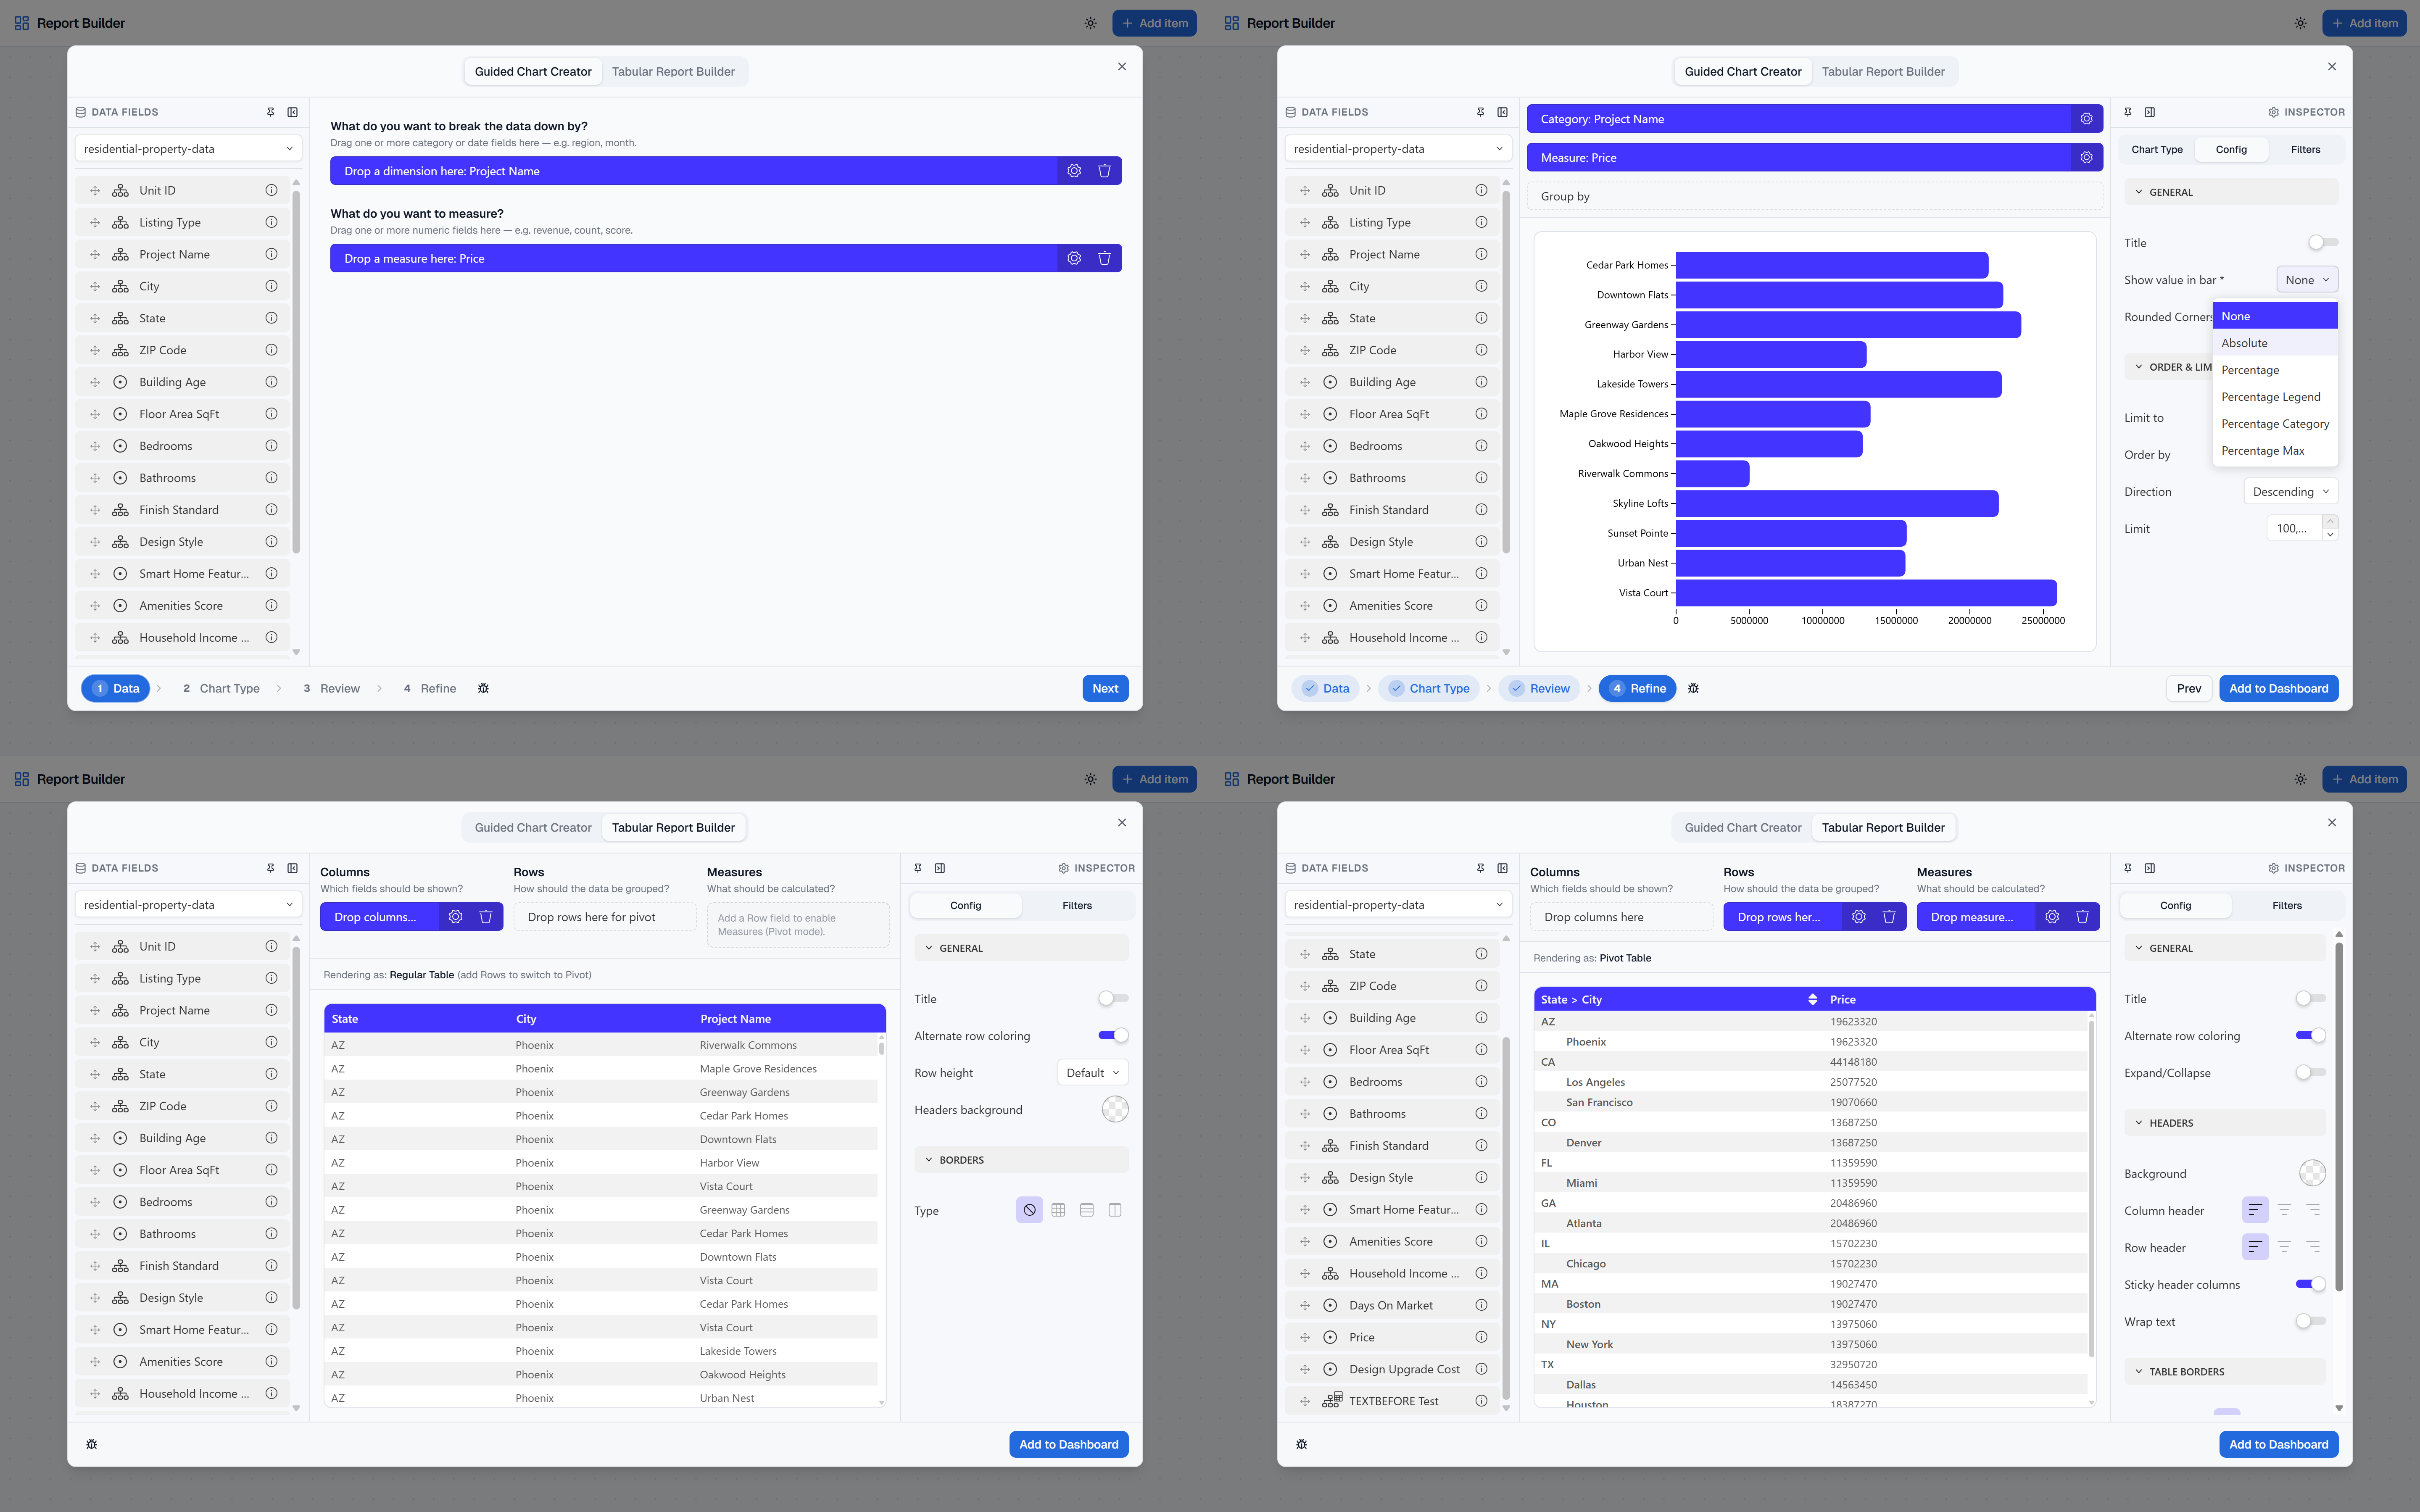
Composable Analytics Builder
Guided end-user report builder powered by Luzmo ACK and Flex.
Users select data fields, pick a chart type, fine-tune options and filters, then drop the result onto a drag-and-drop dashboard grid. Two builder paths are available — a step-by-step chart wizard and a dedicated table/pivot builder — both producing live Flex visualisations.
Features
- Guided Chart Creator — Four-step wizard: select data fields, pick a chart type, review a live preview, then refine config and filters before adding to the dashboard.
- Tabular Report Builder — Build regular tables and pivot tables with slot-based configuration for rows, columns, and measures. Pivot mode activates automatically when a row field is added.
- Dashboard Grid —
<luzmo-item-grid>handles drag-and-drop layout, resize, clone, delete, and edit-in-place. - Smart Chart Type Defaults — A heuristic selects the most appropriate chart type based on the measures and dimensions the user has chosen.
- Live Preview — Charts and tables render in real time via Luzmo Flex as users configure them.
- Theming — Light, dark, and retro (Windows 95) themes applied consistently across the app, ACK components, Flex charts, and the dashboard grid.
Tech Stack
- Next.js 16 (App Router) — React 19
- Tailwind CSS 4 + Radix UI primitives — UI layer
- @luzmo/analytics-components-kit — Data field panel, slot drops, config editors, filters, dashboard grid
- @luzmo/react-embed — Flex chart rendering (
<luzmo-embed-viz-item>) - TypeScript throughout
Getting Started
(Optional) Copy
.env.exampleto.env.localto restrict the data-field picker to specific datasets:NEXT_PUBLIC_LUZMO_DATASET_IDS=your-dataset-id-1,your-dataset-id-2Public datasets work without this file. Chart filters use the dataset(s) linked in the chart slots, not this env var.
No API keys or embed tokens are needed — the app works directly with public datasets.
Install and start:
npm install
npm run dev
The dev server starts at http://localhost:3000.
Build
npm run build
npm start
Authentication
This showcase runs without any authentication at runtime. No API keys, embed tokens, or server-side token minting is required — it works because it targets public Luzmo datasets.
If you need to work with private or protected Luzmo resources, you would need to provide embed credentials (authKey / authToken) to the ACK and Flex components. See the Luzmo authorisation guide for details.
Further Reading
See AGENTS.md for architecture rules and implementation guidelines.
Good decisions start with actionable insights.
Take your data products to the next level with Luzmo.