Custom chart example
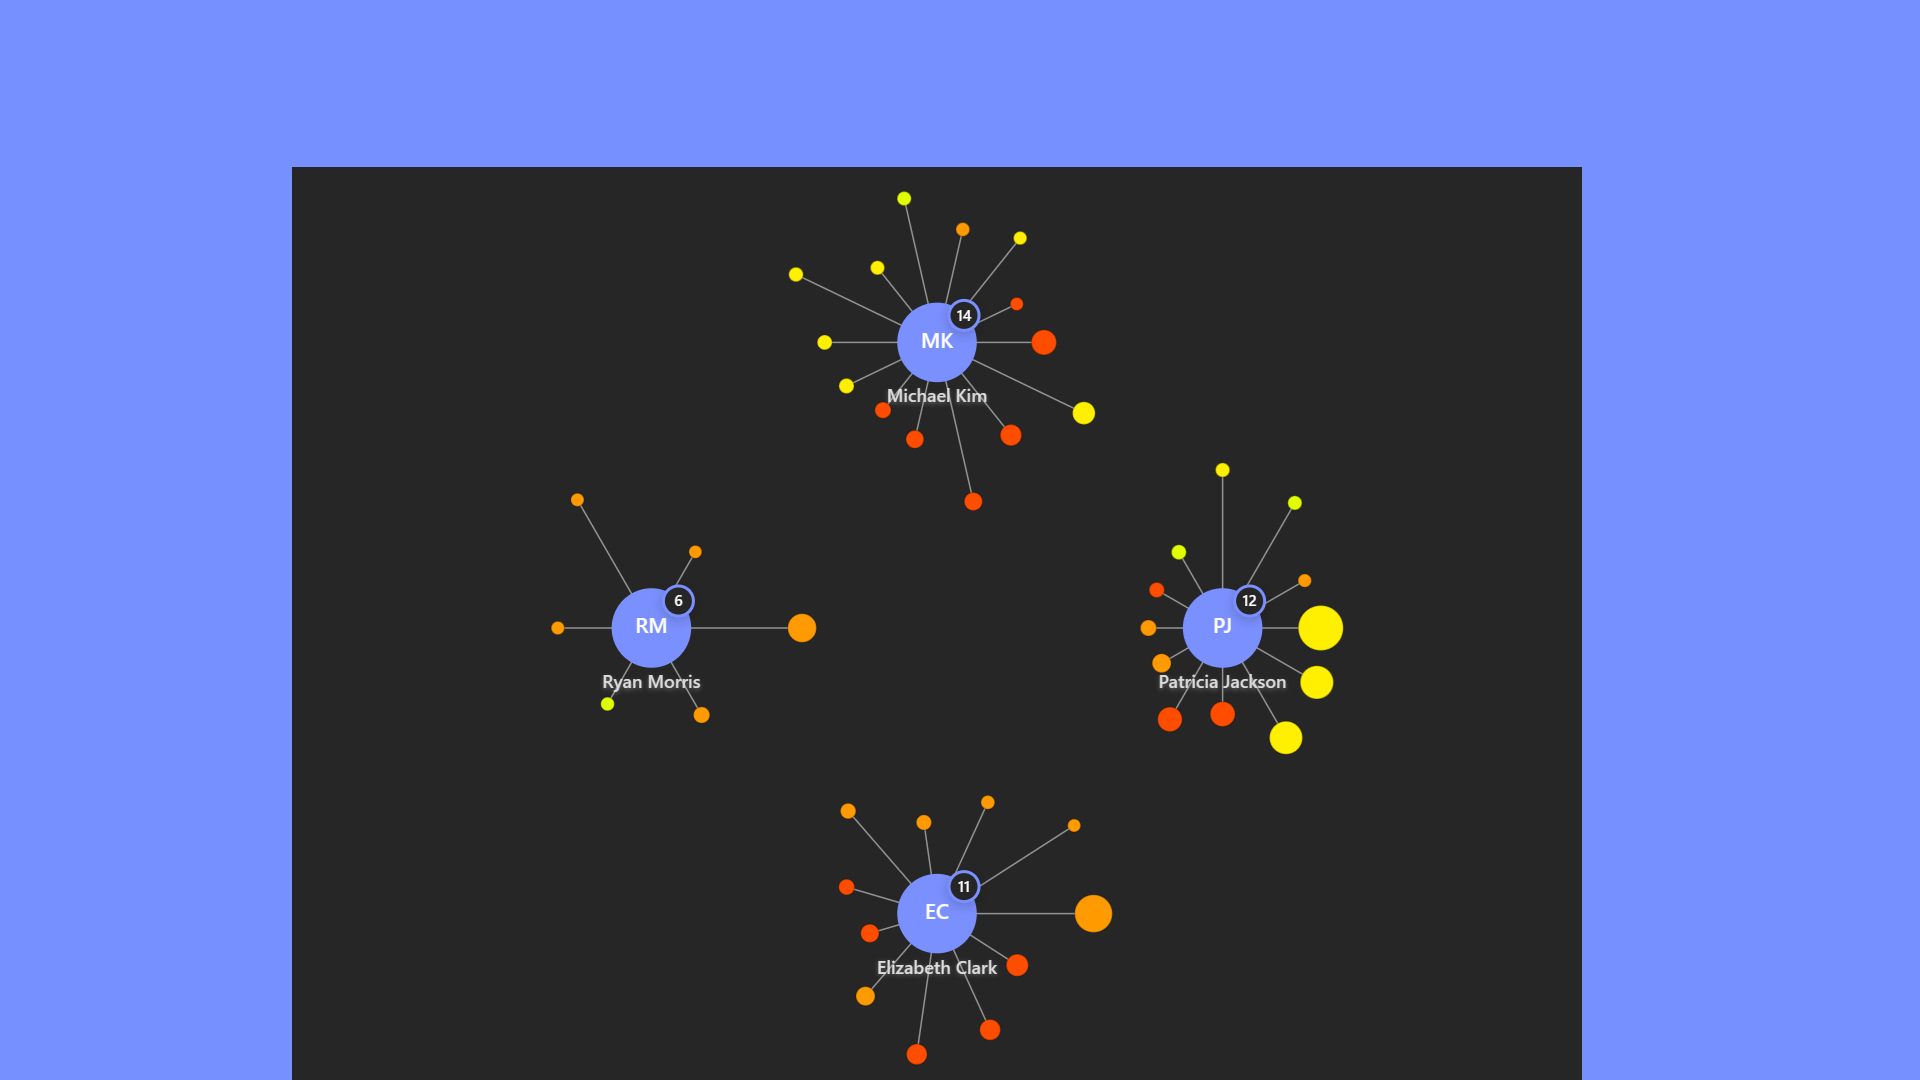
A Luzmo Custom Chart, showing sales representatives and their deals in an interactive circular layout. Built with D3.js and TypeScript, featuring zoom/pan, filtering, and detailed tooltips.
Created by Luzmo.
TypeScript
Custom Chart
Luzmo Custom Chart example: visualization of sales reps and their deals in a Network Graph
This is an example implementation of a Custom Chart that can be uploaded to Luzmo, to be then natively used in Luzmo dashboards.
The visualization displays sales representatives positioned in a circular layout with their deals shown as interactive circles around them.
Installation
If you want to run and develop the chart locally:
- Clone our Custom Chart Builder development environment from GitHub.
- Copy the contents of the
custom-chartfolder in this project and paste and replace the contents of theprojects\custom-chartfolder in the Custom Chart Builder environment. - Run
npm installin the root folder of the Custom Chart Builder development environment to install all dependencies. - Run
npm run startto start the dev environment. You can now access the chart athttp://localhost:4200(also see the Custom Chart Builder documentation for more information). - If you wish, you can now start editing the chart code in the
srcfolder and see the changes live in the dev environment.
Chart configuration
The chart expects the following data slots, configured in the manifest.json file:
- Category: Sales representative names
- Name: Deal names
- Size: Deal amounts (determines circle size)
- Color: Deal probability (determines color gradient)
- Time: Expected close dates (determines circle distance from sales rep)
Chart features
- Deals are positioned based on expected close date and sized by deal amount
- Deal circles use a color gradient to represent win probability (red to green)
- Click on sales reps or deals to interactively filter, seamlessly interacting with other charts in Luzmo dashboards
- Navigate the visualization with smooth zoom and pan controls
- Rich tooltips show deal details on hover
Good decisions start with actionable insights.
Take your data products to the next level with Luzmo.