Block Type Editor
Compose rich, interactive reports with Editor.js and Luzmo analytics components: mix and match charts, key metrics, and text blocks to build polished data stories.
Created by Luzmo.
TypeScript
ACK
Flex
Editing
Block Type Editor
Compose rich, interactive reports with Editor.js and Luzmo analytics components: mix and match charts, key metrics, and text blocks to build polished data stories.
Features
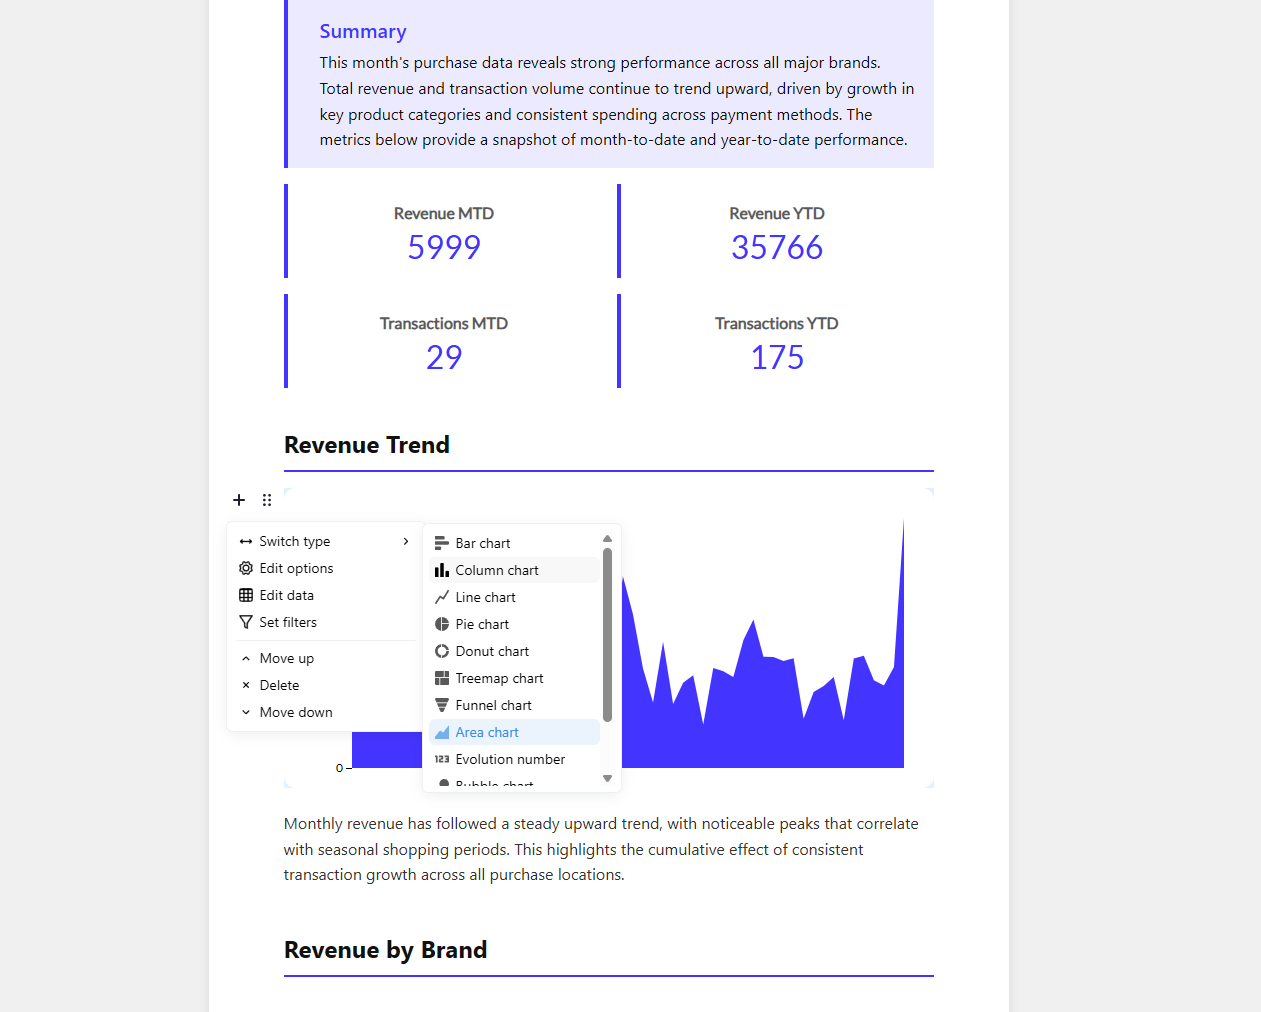
- Chart blocks — Bar, column, line, pie, donut, treemap, funnel, area, bubble, and table visualizations powered by Luzmo
- Key metrics — Summary cards displaying evolution numbers
- Callouts — Info, warning, and danger callout blocks with rich text
- Headers — H2, H3, H4 heading blocks
- Buttons — Link buttons with URL validation
- Lists — Ordered and unordered lists via Editor.js
- Edit / read-only toggle — Switch between editing and viewing modes
- LocalStorage persistence — Report blocks are saved to and restored from localStorage
Prerequisites
- Node.js >= 18
- A Luzmo account with API credentials
Setup
- Clone the repository:
git clone <repo-url>
cd reporting-editorjs-builder
- Install dependencies:
npm install
- Create a
.envfile from the example:
cp .env.example .env
- Fill in your Luzmo API credentials in
.env.
Scripts
| Command | Description |
|---|---|
npm run dev |
Start the Vite dev server |
npm run build |
Type-check and build for production |
npm run preview |
Preview the production build |
npm run lint |
Lint source files with oxlint |
npm run lint:fix |
Auto-fix lint issues |
npm run format |
Format source files with oxfmt |
npm run format:check |
Check formatting without writing |
Project Structure
src/
├── block-tools/          # Custom Editor.js block tools
│   ├── button.ts         # Link button block
│   ├── callout.ts        # Callout block (info/warning/danger)
│   ├── header.ts         # Heading block (H2–H4)
│   ├── luzmo-key-metrics.ts  # Key metrics summary cards
│   └── luzmo-viz-item.ts     # Chart/visualization block
├── styles/               # SCSS partials
├── utils/                # Shared utilities (filter transforms)
├── blocks-data.ts        # Default block data
├── data.ts               # Dataset and column definitions
├── main.ts               # App entry point & Editor.js init
└── report.ts             # Report config and localStorage persistence
Good decisions start with actionable insights.
Take your data products to the next level with Luzmo.